We will treat conformational transitions in a general framework, but focus on collective conformational transitions. Mainly due to entropic barriers, these are generally slow in terms of transition rates and occur on time scales above nanoseconds. However, an actual event of barrier crossing may be as fast as a few picoseconds. For a study of these motions one has (a) to search for distinct low-energy conformations, (b) to find reaction paths connecting the conformations in configuration space, and (c) to estimate transition rates or mean transition times. `Conformational flooding' provides a means to carry out tasks (a) and (b). Estimates can be derived for task (c), but here established techniques are more accurate and, therefore, are recommended.
The potential energy landscape of proteins is quite complex, and so is the free energy landscape. To reduce that complexity, we develop an effective, coarse-grained description with an adjustable level of coarse graining. We will proceed in three steps. First, we will introduce the notion of `conformation space' as a subspace in configuration space. On this subspace we will consider a free energy landscape. Second, we will motivate a proper choice of linear collective coordinates. Third, these `conformational coordinates' will serve to construct a substate model in terms of a harmonic free energy.
From a conventional MD-simulation one obtains an ensemble of Sstructures (`snapshots') ![]() ,
,
![]() , where
, where
![]() denotes
the 3N dimensional configuration vector
consisting of the Natomic positions of the N atoms within the system selected to be
subjected to the flooding forces.
This ensemble is used to estimate the configuration space
density
denotes
the 3N dimensional configuration vector
consisting of the Natomic positions of the N atoms within the system selected to be
subjected to the flooding forces.
This ensemble is used to estimate the configuration space
density
![]() , which characterizes
the initial (known) conformational substate.
, which characterizes
the initial (known) conformational substate.
We can obtain a coarse-grained description of
![]() (i.e.,
of the initial substate) by considering
a number m
(
(i.e.,
of the initial substate) by considering
a number m
(
![]() )
of `conformational' (typically collective)
degrees of freedom
)
of `conformational' (typically collective)
degrees of freedom
![]() , which are assumed to be
involved in the conformational motion. Here, m enters as an adjustable
parameter, as does the selection of the N atoms to be affected
during the flooding simulation.
, which are assumed to be
involved in the conformational motion. Here, m enters as an adjustable
parameter, as does the selection of the N atoms to be affected
during the flooding simulation.
The m conformational coordinates are extracted from an unperturbed
MD simulation by means of a principal component analysis [16].
Below, the averages
![]() denote ensemble averages
over the unperturbed MD trajectory.
denote ensemble averages
over the unperturbed MD trajectory.
From the covariance matrix
![]() we derive a symmetric, positive definite
we derive a symmetric, positive definite
![]() -matrix
-matrix
![]() , which serves to approximate
the configuration space density
, which serves to approximate
the configuration space density
![]() in terms of a multivariate Gaussian distribution,
in terms of a multivariate Gaussian distribution,
![]()
where Z is an appropriate normalization.
Care has to be taken that rigid body motions (rotations and translations) are prohibited during that process, since these would `smear out' the configuration space density.
Diagonalizing
![]() with orthonormal
with orthonormal
![]() and diagonal
and diagonal
![]() yields
collective coordinates
yields
collective coordinates
![]() ,
which serve to simplify Eq. (6.13):
,
which serve to simplify Eq. (6.13):
![]()
For our coarse-grained description we select the mcollective coordinates
![]() with smallest
eigenvalues
with smallest
eigenvalues ![]() . That number
m of
conformational degrees of freedom
. That number
m of
conformational degrees of freedom ![]() which are explicitly considered determines
the level of coarse-graining.
which are explicitly considered determines
the level of coarse-graining.
On the subspace of the ci we define a
`conformation space density'
![]() as
the projected configuration space density
as
the projected configuration space density
![\begin{eqnarray}\html{eqn34}\rho^{{\bf c}}({\bf c})&=&
\int d^{3N}x'\,\rho^{{\bf...
...approx &Z^{-1}\exp[-\frac{1}{2}{\bf c}^T{\bf\Lambda}_c{\bf c}]\,,
\end{eqnarray}](img119.gif)
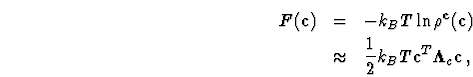
The coarse-grained substate model in terms of
![]() serves
to design a
`flooding'-potential
serves
to design a
`flooding'-potential
![]() , which is to be included
into the force field during MD-simulations, and which is
supposed to accelerate conformational transitions. In agreement with our assumption that the
conformational coordinates ci describe conformational transitions sufficiently accurate,
we define the flooding potential as a function of only these
m degrees of freedom. Note that during a flooding simulation
all (not only the mci) degrees of freedom are
considered, so no real elimination of degrees of freedom takes
place here.
, which is to be included
into the force field during MD-simulations, and which is
supposed to accelerate conformational transitions. In agreement with our assumption that the
conformational coordinates ci describe conformational transitions sufficiently accurate,
we define the flooding potential as a function of only these
m degrees of freedom. Note that during a flooding simulation
all (not only the mci) degrees of freedom are
considered, so no real elimination of degrees of freedom takes
place here.
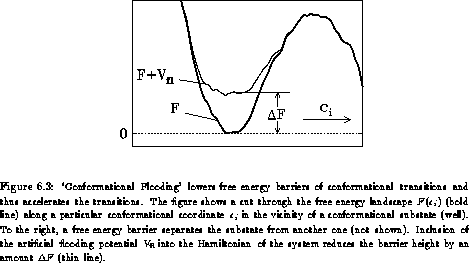
Qualitatively, we
modify the free energy landscape F as indicated in
Fig. 6.3. In the figure, the bold line represents
![]() in the vicinity of a substate (well)
as a function of one particular ci.
Also shown is a free energy barrier separating the initial
substate from other substates
(which are not shown). The purpose of the
flooding potential
in the vicinity of a substate (well)
as a function of one particular ci.
Also shown is a free energy barrier separating the initial
substate from other substates
(which are not shown). The purpose of the
flooding potential
![]() is
to rise the free energy within the substate (thin line) as to
destabilize that initial substate and to drive the system into another
substate. As is also indicated in the figure,
we require
is
to rise the free energy within the substate (thin line) as to
destabilize that initial substate and to drive the system into another
substate. As is also indicated in the figure,
we require
![]() to be short-ranged, so that the barrier is unaffected.
With that assumption, the free energy barrier height is
reduced by a destabilization free energy
to be short-ranged, so that the barrier is unaffected.
With that assumption, the free energy barrier height is
reduced by a destabilization free energy ![]() indicated in the figure
and defined below, and one expects a corresponding acceleration
indicated in the figure
and defined below, and one expects a corresponding acceleration
![]() of conformational transitions.
That process is termed `conformational flooding'.
of conformational transitions.
That process is termed `conformational flooding'.
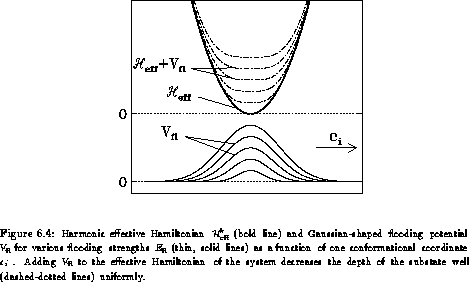
To ensure that
![]() `fits' into the initial substate
(cf. Fig. 6.4)
we chose a (multivariate) Gaussian,
`fits' into the initial substate
(cf. Fig. 6.4)
we chose a (multivariate) Gaussian,
![]()
(not to be mixed up with the density model
![]() ,
which only accidentally happens to have the same functional form),
where
,
which only accidentally happens to have the same functional form),
where
![]() is the strength of the flooding potential, and
is the strength of the flooding potential, and
![]() determines the overall extension of
the flooding potential.
With that choice,
determines the overall extension of
the flooding potential.
With that choice,
![]() reduces the depth of the energy
well uniformly without extending much into the high energy regions
of conformation space, where barriers are to be expected.
reduces the depth of the energy
well uniformly without extending much into the high energy regions
of conformation space, where barriers are to be expected.
We would like to stress that our flooding potential will not push the system
towards any preselected destination
in configuration space; hence, no bias is included as to which product
state the system will move. Rather, the method is likely to follow
transition paths of low free energy
and thus should identify those neighboring conformational substates, to
which also the unperturbed system (
![]() ) would move at much
slower time scales.
) would move at much
slower time scales.
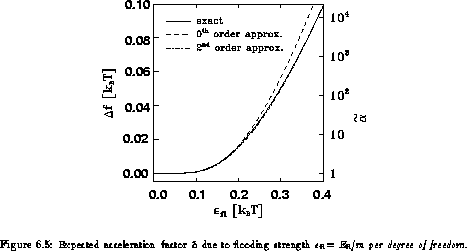
As a rule of thumb, Fig 6.5 provides an upper limit
for the expected acceleration factor
![]() for
various flooding strengths per degree of freedom,
for
various flooding strengths per degree of freedom,
![]() . Also given is the corresponding
destabilization free energy
. Also given is the corresponding
destabilization free energy
![]() per degree of freedom.
per degree of freedom.
For a more detailed description, for estimates of the acceleration factor, and for two sample applications, see [22].